

Understanding the Head and Shoulders Stock Chart Pattern
In the realm of technical analysis in the stock market, patterns play a crucial role in predicting future price movements. Among these patterns, the head and shoulders pattern stands out as one of the most recognizable and reliable indicators of potential trend reversals. Traders and analysts keen on identifying shifts in market sentiment often turn to this pattern for insights into possible upcoming price movements. In this article, we’ll delve into the intricacies of the head and shoulders pattern, exploring its anatomy, significance, interpretation, and application in trading strategies.
Anatomy of the Head and Shoulders Pattern
The head and shoulders pattern typically forms after an extended uptrend and signals a potential trend reversal from bullish to bearish. As its name suggests, the pattern resembles a human head and shoulders outlined within the price action.
Let’s break down its components:
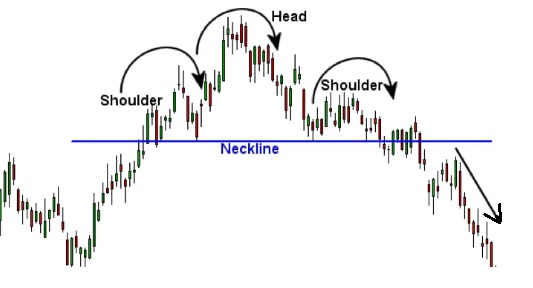
Left Shoulder: The pattern begins with a peak in the price, representing the left shoulder. This peak is typically formed during the final stages of an uptrend, indicating bullish exhaustion.
Head: Following the left shoulder, there’s a higher peak called the head. This peak represents a short-term resurgence in buying pressure, often leading to new highs. However, the subsequent decline from this peak suggests that the bulls are losing momentum.
Right Shoulder: After the formation of the head, there’s a pullback in price followed by another attempt to rise, forming the right shoulder. The peak of the right shoulder is typically lower than that of the head, indicating weakening bullish momentum.
Neckline: Connecting the lows of the left shoulder, head, and right shoulder is the neckline. The neckline serves as a crucial level of support. A breach of this level confirms the completion of the pattern and suggests a high probability of a trend reversal.
Significance of the Head and Shoulders Pattern
The head and shoulders pattern holds significance due to its ability to provide traders with actionable insights into market sentiment. Here are some key points highlighting its importance:
- Trend Reversal Signal: The completion of the head and shoulders pattern signals a transition from bullish to bearish sentiment. It suggests that buyers are losing control, and sellers may soon take over, leading to a potential downtrend.
- Price Target Projection: By measuring the distance from the head to the neckline, traders can estimate the potential magnitude of the subsequent downtrend. This projection provides a target for profit-taking or setting stop-loss levels.
- Volume Confirmation: Volume plays a vital role in validating the head and shoulders pattern. Ideally, volume should decline as the pattern forms and increase upon the breakout below the neckline. This volume confirmation adds credibility to the pattern’s reliability.
- Psychological Aspect: The head and shoulders pattern reflects shifts in market psychology. The formation of higher highs followed by lower highs indicates diminishing optimism among investors, paving the way for bearish sentiment to prevail.
Interpretation and Trading Strategies
Interpreting the head and shoulders pattern involves more than just identifying its visual characteristics. Traders often employ various strategies to capitalize on its formation. Here are some common approaches:
- Confirmation Entry: Traders may wait for confirmation of the pattern by observing a decisive close below the neckline. This confirms the validity of the pattern and serves as a trigger for initiating short positions or exiting long positions.
- Pullback Entry: Alternatively, some traders may opt for a pullback entry strategy. Instead of waiting for confirmation below the neckline, they enter short positions on a pullback to the neckline after the formation of the right shoulder. This approach allows for a tighter stop-loss and potentially better risk-reward ratio.
- Volume Analysis: Analyzing volume can provide additional confirmation of the pattern’s validity. Traders look for a decrease in volume during the formation of the pattern, followed by a surge in volume upon breakout below the neckline. This surge in volume adds conviction to the trade setup.
- Price Target Calculation: To establish profit targets, traders often measure the vertical distance from the head to the neckline and project it downwards from the breakout point. This projected distance serves as a guide for setting realistic price targets.
Real-World Example
Let’s consider a hypothetical example to illustrate the application of the head and shoulders pattern in a real-world scenario:
Suppose a stock, XYZ Inc., has been in a prolonged uptrend for several months. As the price reaches a peak, forming the left shoulder, it experiences a minor pullback before rallying to a higher peak, forming the head. However, this rally lacks the strength seen in previous uptrends.
After the formation of the head, the price retreats once again but fails to surpass the peak of the head, forming the right shoulder. As the price breaks below the neckline, accompanied by a surge in volume, traders interpret this as a confirmation of the head and shoulders pattern.
Based on the measurement of the distance from the head to the neckline, traders project a potential downside target. They initiate short positions with stop-loss orders placed above the neckline. As the price declines towards the projected target, traders book profits or adjust their positions accordingly.
Conclusion
The head and shoulders pattern stands as a prominent tool in the arsenal of technical analysts and traders. Its ability to signal potential trend reversals makes it a valuable asset for identifying entry and exit points in the market. However, like any technical indicator, it is not infallible and should be used in conjunction with other tools and analysis methods.
Traders should exercise caution and employ risk management strategies to mitigate potential losses. Additionally, staying abreast of market developments and maintaining a disciplined approach to trading are essential for success. By understanding the anatomy, significance, and interpretation of the head and shoulders pattern, traders can enhance their ability to navigate the dynamic landscape of the stock market.
**Here’s a little transparency: Our website contains affiliate links. This means if you click and make a purchase, we may receive a small commission. Don’t worry, there’s no extra cost to you. It’s a simple way you can support our mission to bring you quality content.**