You may have heard about the Fibonacci sequence if you spend time around markets and trading discussions. It’s a series of numbers where each number is the sum of the two preceding ones. The significance of these numbers extends beyond math class; it’s a tool that traders use to predict potential market movements.
The sequence was introduced to the Western world by Leonardo of Pisa, better known as Fibonacci, in the 13th century. Since then, the series has been noticed in various aspects of life, including the financial markets. The recurrence of Fibonacci numbers in natural patterns intrigued traders who sought out patterns in market trends.
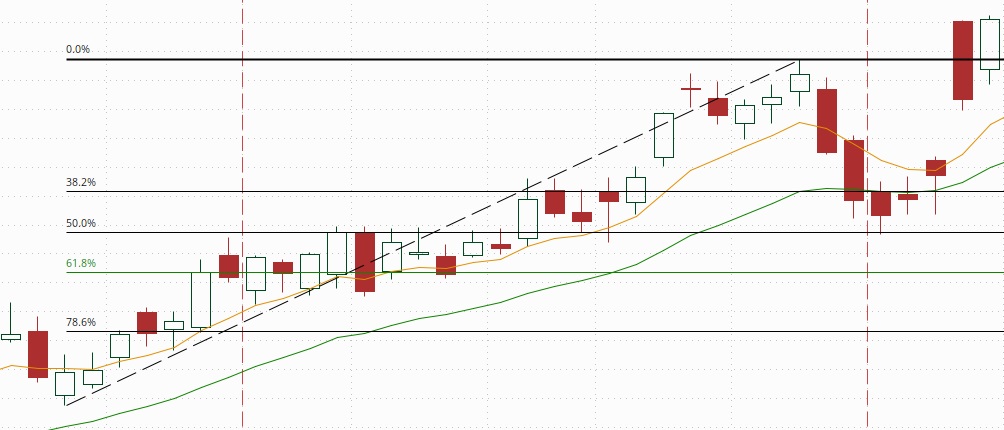
Fibonacci retracement is a technical analysis tool that uses horizontal lines to indicate areas of support or resistance at the key Fibonacci levels before the price continues in the original direction. These levels are derived by drawing a trendline between two extreme points and then dividing the vertical distance by the key Fibonacci ratios, which are 38.2%, 50%, 61.8% and 78.6%.
Traders turn to Fibonacci levels to guide their decisions because these levels often mark the points where market movement will pause or reverse. It offers a way to predict areas of interest for pauses in trends or potential reversal points, which can be invaluable in trade decision-making. With their use becoming well-integrated into many trading strategies, the Fibonacci sequence has earned its place in the technical analyst’s toolkit.
Transitioning from the basics to practical application, let’s explore how you can master these strategies in your own trading endeavors. The next section elaborates on drawing Fibonacci levels and using them to identify key entry and exit points.
Mastering Fibonacci Retracement Strategies
To effectively integrate Fibonacci retracement into your trading arsenal, it is crucial to understand how to set these levels up on a chart. First, select a significant peak and trough on a price chart. Then, using trading software, draw the Fibonacci retracement levels between these two points. This action will automatically generate horizontal lines that represent potential support and resistance areas at key Fibonacci levels, typically 38.2%, 50%, 61.8%, and sometimes 78.6%.

A solid understanding of how to interpret these lines can form the backbone of your trading decision-making process. For instance, if the price of an asset pulls back to a significant Fibonacci level and then shows signs of resuming its initial trend, you might consider this a good point to enter the trade. Additionally, identify where multiple Fibonacci levels converge with other technical indicators or signals, as this can pinpoint areas of increased market interest.
Putting Fibonacci retracements into the context of your overall trading strategy demands discipline and practice. Consider paper trading to simulate how these levels interact with real market movements without any financial risk. When doing so, pay attention to how the price behaves around these levels, looking for patterns of pullbacks or reversals.
It’s also essential to note the success of any approach using Fibonacci retracement depends on proper risk management. While Fibonacci can provide clues about potential market turns, it’s not a foolproof system. Always be prepared for scenarios where the market fails to respect these levels and plan your stop loss and take-profit points accordingly.
The Psychological Aspect of Fibonacci Retracement in Markets
Every trader needs to grasp that numbers aren’t the only driving force behind trades – human emotions play a sizable role as well. Traders around the globe watch Fibonacci levels, creating a collective anticipation that can influence market movements.
The idea that Fibonacci retracement can become a self-fulfilling prophecy is fascinating. When enough traders adjust their positions at these levels, it often results in the price reacting accordingly, validating the retracement strategy.
I won’t sugarcoat it: managing emotions while trading is not easy. Keeping a cool head and sticking to your strategy is essential, especially when Fibonacci levels are tested. It’s a mental game as much as a numbers game.
Using Fibonacci retracements requires more than just drawing lines on a chart. It demands an understanding of market sentiment and a disciplined approach to trading. Remember, emotional control is your asset in this volatile environment.
Enhance Your Fibonacci Trading Skills with Expert Resources
I can’t stress enough the importance of continuing education in the world of trading. It’s this kind of dedication that separates the successful from the rest.
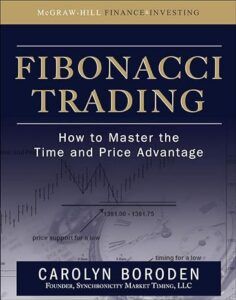
If you’re serious about harnessing the power of Fibonacci retracement in your trading strategy, the book ‘Fibonacci Trading’ by Carolyn Boroden could be a game-changer for you. I highly recommend this resource for anyone looking to dive into the nuances of Fibonacci and apply these principles with greater confidence.
Boroden’s book doesn’t just go over the basics; it provides a deep dive into trading tactics, specifically focusing on Fibonacci’s applications in varying market conditions. The book is rich with real-world examples, which could help you translate theory into practice.
In addition to reading insightful resources like Boroden’s comprehensive guide, actively seek out other learning opportunities. Webinars, workshops, and even discussions with fellow traders can offer new perspectives and enhance your skill set. Remember, markets evolve, and so should you.
In conclusion, embrace a culture of continuous improvement and resourcefulness. By doing so, you’re not just investing in your trading strategy; you’re investing in yourself as a trader. Combine the technical knowledge from books, the experiential insights from networking, and the psychological acumen from market observation. That’s how you level up in trading.


Very informative article on using the Fibonacci principle for trading! I’ve heard of Fibonacci before related to art & photography. Beautiful art and photos can be created using the Fibonacci sequence. This is the first time I’ve heard of this related to trading. I do see how this can be useful- still a bit complex though in my opinion for beginners. I do not have context to place the percentages in that you mentioned. Is this a beginners strategy or meant for someone that’s been trading for a long time?
Thank you for the thoughtful comments. The strategy can be used by both beginners and experience traders. Most trading platforms like Think or Swim have the Fibonacci tool available for quick use. The beginner would need to understand that the Fibonacci retracements and extensions should be used in conjunction with other technical analysis tools, such as moving averages and key support/resistance levels and therefore they would also need to have familiarity with those.
Hi Robert, This is a fascinating post. I’ve heard of Fibonacci retracement but never understood it until now. You explain it very simply and effectively. You are clearly an expert in this trading area, so you will certainly gain a ranking as an authority site!
I have 2 questions:
1. You mention ‘Market Sentiment.’ I’ve never heard of this term before, so I’d appreciate a definition.
2. What effect do you anticipate AI having on this finely-tuned aspect of trading and investment? Or has it already started?
Blessings and Success.
Linden
Thank you for the review and kind words about the content of this article.
Regarding your 2 questions:
1. Market sentiment refers to the overall attitude or mood of investors and traders towards a particular market or asset. In the context of stock market trading, market sentiment reflects the collective perception of investors about the direction in which the market or specific stocks are likely to move. It is often influenced by various factors such as economic indicators, geopolitical events, corporate earnings reports, news headlines, and investor behavior.
Market sentiment can be categorized into bullish sentiment and bearish sentiment:
a. Bullish Sentiment: When investors are optimistic about the future prospects of the market or specific stocks, they exhibit a bullish sentiment. This may lead to increased buying activity, rising stock prices, and overall positive market momentum.
b. Bearish Sentiment: Conversely, when investors are pessimistic about the market or specific stocks, they exhibit a bearish sentiment. This may result in increased selling activity, declining stock prices, and overall negative market momentum.
Market sentiment can also be measured through various indicators and metrics, such as surveys, sentiment indices, options market activity, and social media sentiment analysis. Understanding market sentiment is important for traders and investors as it can influence their trading decisions and overall market behavior.
2. AI has already begun to significantly impact trading and investment, and its influence is expected to continue growing in the future. Overall, AI is revolutionizing trading and investment by enabling faster decision-making, improving risk management, and enhancing market efficiency. However, it also poses challenges such as algorithmic biases, regulatory concerns, and the potential for market disruptions. As AI technology continues to evolve, its impact on trading and investment is likely to become even more profound.