When you start trading, you’ll quickly hear about the concepts of ‘support’ and ‘resistance.’ These aren’t just terms thrown around to sound sophisticated; they’re fundamental tools that traders use every day to make decisions. I think of support and resistance as the floor and ceiling of a room, offering potential barriers to price movement.
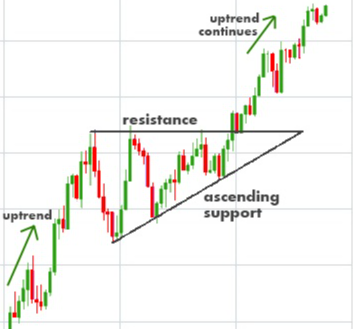
Support is the price level at which demand is thought to be strong enough to prevent the price from declining further. It’s like a safety net, where buyers tend to enter or increase their positions, potentially driving the price up. Resistance, on the other hand, is where the price tends to top off; it’s the point at which selling interest is high enough to overcome buying pressure and push the price back down.
These concepts stem from market psychology. You see, support and resistance levels are not just lines on a chart; they represent the collective outlook and behavior of market participants. Human emotions heavily influence these levels, as traders recall past performances of a stock at these key price points and base their future decisions upon them.
Identifying support and resistance involves observing price history and recognizing patterns. Traders look for areas where the price has reversed direction multiple times in the past, and they anticipate that it’s likely to happen again. It’s one of those skills where practice and experience play a big role.
Moreover, understanding these levels can be incredibly helpful for anyone involved in the markets. Whether you’re a day trader looking for quick profits or a long-term investor seeking to bolster your portfolio, knowing where these invisible barriers lie can give you an advantage.
Grasping the concept of support and resistance levels is a solid first step. Now, let’s move forward and delve into how these principles can significantly impact your trading decisions and actions.
Analyzing the Impact of Support and Resistance on Trading Decisions
In the grand scheme of trading, support and resistance levels are akin to the strategic markers on a battlefield. They guide traders by highlighting potential turning points where the market could experience a shift in supply and demand dynamics.
When considering these levels, it’s important to recognize how they can act as crucial signposts for determining entry and exit points. Traders often look for buying opportunities at or near support levels, where demand is anticipated to increase and surpass supply, potentially driving prices up. Conversely, finding selling opportunities near resistance levels, where supply may overcome demand, could suggest a price decline.
Trading styles from day trading to long-term investing hinge on these fundamental concepts, each employing them uniquely. Day traders may use these indicators to make multiple trades over a single session, while swing traders might rely on them to capture larger market moves over several days or weeks. Position traders, looking at the even bigger picture, leverage support and resistance to inform trades that could remain open for months.
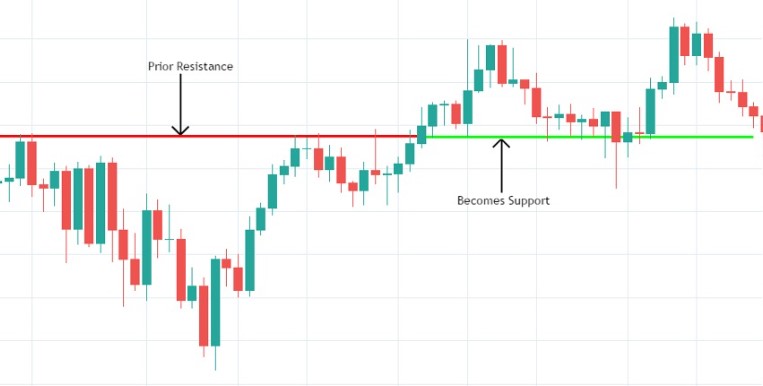
An intriguing aspect of these levels is their tendency to switch roles. What was once a resistance level can become a new support level once it is breached, and vice versa. This phenomenon reflects a change in market sentiment; traders should monitor for such shifts as they often denote significant trend changes.
Firm understanding of these principles prepares you for the next step: mastering the tools and techniques for charting and identifying support and resistance which is crucial for any trader aiming to improve their market analysis.

Tools and Techniques for Charting Support and Resistance
As I sharpen my focus on the practicalities of charting support and resistance, I’m reminded that the right tools can make all the difference. For traders, these are not just lines on a chart; they’re a roadmap to potential price movements. They provide a visual representation of where buying and selling pressures are likely to ebb and flow.
Technical analysis tools play a pivotal role here. For instance, trend lines are drawn connecting highs or lows to represent support and resistance. More advanced tools like Fibonacci retracement levels can also be used to identify potential reversal points based on previous price movements.
Candlestick patterns hold special importance in this context. Patterns like ‘double tops’ and ‘double bottoms’ help pinpoint these critical levels where trends can pause or reverse. Candlesticks give traders a quick snapshot of market sentiment, offering clues about potential support or resistance zones.
Dynamic levels are another aspect to consider. Moving averages — such as the 50-day or 200-day — often act as support or resistance because they’re closely watched by traders. When prices approach these moving averages, I prepare for the market to potentially react.
Volume is the often-neglected backbone of support and resistance credibility. A surge in volume at a certain price point can reinforce the strength of that level. If a breakout occurs, high volume can confirm that the breakout is more likely to hold rather than turn out to be a false signal.
With this understanding, I’m equipped to outline strategies that integrate these tools. In the next section, I’ll offer concrete examples and actionable tips to help you apply these techniques in your own trading.
Practical Tips for Trading with Support and Resistance Strategies
Incorporating support and resistance strategies into your trading plan can provide structure and clarity. Make sure that your plan includes specific criteria for identifying these levels and outlines how you’ll use them to inform your trades.
Understanding how to set stop losses effectively can be a game-changer in risk management. Identify key levels for stop losses to protect your capital and lock in profits, keeping in mind the balance between not getting stopped out prematurely and allowing enough room for the trade to work.
Learning from past trades is crucial. Study examples of trades that successfully utilized support and resistance levels to understand what worked and why. This retrospective can sharpen your strategies and reinforce good trading habits.
Finally, stay adaptable. The market is dynamic, and so should be your approach to support and resistance trading. Continuously educate yourself and be ready to adjust your strategies in response to changing market conditions.
**Here’s a little transparency: Our website contains affiliate links. This means if you click and make a purchase, we may receive a small commission. Don’t worry, there’s no extra cost to you. It’s a simple way you can support our mission to bring you quality content.**


Hi there,
Your article gives a fantastic breakdown of support and resistance levels and their pivotal role in trading decisions. I’m intrigued to learn more about the potential hiccups or hurdles traders might face when solely relying on these levels. Could you share your thoughts on instances where support and resistance levels might not give an accurate prediction of market movements? Additionally, how would you suggest traders navigate through such situations?
Thank you for the kind words, Daniella. Regarding your questions, here are my thoughts. While support and resistance levels are essential tools in trading, they’re not foolproof. Market dynamics, news events, and unexpected shifts can invalidate these levels. False breakouts or breakdowns are common, leading traders astray. Moreover, in highly volatile markets or during periods of low liquidity, support and resistance levels may fail to hold. No one really knows what will happen at support or resistance with 100% certainty. It is important consider other technical indicators, such as moving averages and to be ready to adjust or close positions quickly when key levels are clearly broken.
The article offers a comprehensive overview of support and resistance levels in trading, effectively demystifying these fundamental concepts for both novice and seasoned traders. By likening support and resistance to the floor and ceiling of a room, the author provides a clear and accessible analogy for understanding how these levels act as barriers to price movement. The emphasis on the psychological aspect of trading, where human emotions and behaviors influence these levels, adds depth to the discussion, acknowledging the complex interplay between market dynamics and trader psychology.
However, while the article excels in explaining the importance of identifying support and resistance levels and integrating them into trading strategies, it could benefit from a deeper exploration of how to adapt these strategies in rapidly changing markets. Additionally, examples of real-life trading scenarios where support and resistance levels played a critical role could further enrich the article, offering readers tangible insights into the practical application of these concepts.
Questions for further discussion:
How do you recommend adjusting support and resistance strategies in highly volatile markets, where price movements can be unpredictable?
Can you provide examples of trading scenarios where support and resistance levels did not hold as expected, and how traders can respond to such situations to minimize losses?
Gary,
Thank you for your comments on this article. I appreciate your candid feedback as I strive to continue providing quality content on this important topic. You provided some great advice to include specific examples and real-life scenarios in a future article on this topic.
Regarding your questions:
1. In highly volatile markets where price movements are unpredictable, adjusting support and resistance strategies is crucial for effective trading. Here are some recommendations:
• Widen the Range: Expand the range around support and resistance levels to accommodate for increased volatility. This allows for more flexibility in trading decisions.
• Dynamic Levels: Instead of relying solely on fixed support and resistance levels, consider using dynamic indicators such as moving averages or Bollinger Bands. These indicators adjust to market conditions and provide more accurate signals.
• Confirmation Signals: Wait for confirmation signals such as candlestick patterns or volume spikes before entering trades at support or resistance levels. This helps to reduce the risk of false breakouts or breakdowns.
• Tight Risk Management: Implement strict risk management techniques such as setting tight stop-loss orders to minimize potential losses in case the market moves against your position.
• Adaptability: Stay flexible and be prepared to adjust your strategies quickly as market conditions evolve. Keep monitoring price action and reassessing support and resistance levels regularly.
2. Support and resistance levels do not always hold for a variety of reasons. Here are some examples and possible ways to respond:
• False Breakouts: Sometimes, price may temporarily break through a support or resistance level but then quickly reverse direction. In such cases, traders can wait for the candlestick to close back within the support or resistance zone before entering a trade. This helps to confirm the validity of the breakout and reduces the risk of entering false positions.
• Market Shocks: Unexpected news events or economic data releases can cause support or resistance levels to break unexpectedly. Traders can respond by closely monitoring price action following such events and avoiding entering new positions until the market stabilizes. Alternatively, traders can hedge their positions using options or other derivatives to limit potential losses.
• Low Liquidity Environments: In low liquidity environments, support and resistance levels may not hold as strongly due to fewer market participants. Traders should exercise caution and avoid trading large positions in such conditions. It’s also advisable to use limit orders instead of market orders to avoid slippage.
• Strong Trend Reversals: In some cases, support and resistance levels may fail to hold due to a significant shift in market sentiment or trend reversal. Traders can respond by closing out existing positions and waiting for clearer signals indicating the direction of the new trend. Additionally, they can consider using trailing stop-loss orders to protect profits in case of sudden reversals.
Hopefully this helps.
Robert