
The Art of Stock Market Trend Patterns: Triangles, Pennants, and Flags
The stock market is a dynamic arena where investors strive to decode the intricate patterns that dictate market movements. Among the many tools and techniques employed in technical analysis, patterns such as triangles, pennants, and flags stand out for their predictive potential. These patterns not only provide valuable insights into market sentiment but also aid traders in making informed decisions. Let’s dive into the world of these geometric formations and unravel their significance in the realm of stock market analysis.
Triangles: The Symmetrical, Ascending, and Descending
Triangles are among the most recognizable and frequently observed patterns in technical analysis. They are characterized by converging trend lines that signify a period of consolidation before a potential breakout or breakdown. The three primary types of triangles include:
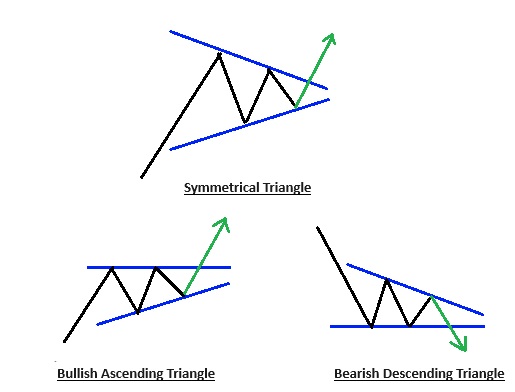
- Symmetrical Triangle: In a symmetrical triangle, the upper and lower trend lines converge at a roughly equal slope, indicating a period of indecision in the market. As the price oscillates between these converging lines, traders anticipate a breakout in either direction. A decisive breach of one of the trend lines typically signals a continuation of the previous trend.
- Ascending Triangle: An ascending triangle is formed when the upper trend line remains flat, while the lower trend line slopes upwards. This pattern suggests a gradual accumulation of buying pressure, with the price repeatedly testing resistance levels. A breakout above the upper trend line often results in a bullish rally, as buyers overpower sellers.
- Descending Triangle: Conversely, a descending triangle is characterized by a flat lower trend line and a descending upper trend line. This pattern indicates a gradual erosion of buying interest, with sellers exerting pressure on the price. A breakout below the lower trend line is usually interpreted as a bearish signal, triggering a downward movement in the stock’s price.

Pennants: Consolidation Before Momentum
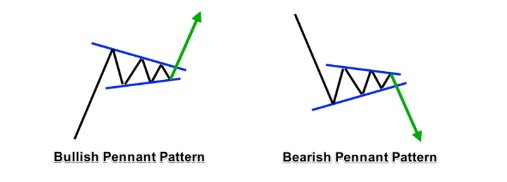
Pennants are short-term continuation patterns that resemble triangles, often preceded by a sharp price movement, known as the flagpole. These formations signify a brief pause in the prevailing trend, as the market consolidates before resuming its prior trajectory. Pennants are distinguished by their converging trend lines, similar to triangles, albeit on a smaller scale. Traders closely monitor pennant patterns for signs of a breakout or breakdown, as they offer valuable insights into the intensity of buying or selling pressure.
Flags: The Mark of Momentum
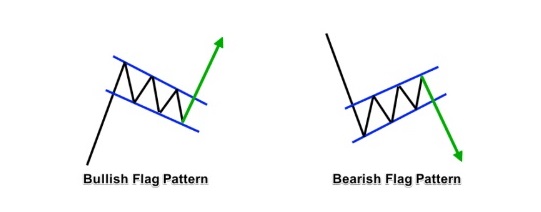
Flags are closely related to pennants and are characterized by their rectangular shape, formed by parallel trend lines. These patterns typically emerge after a strong upward or downward price movement, signaling a temporary pause or consolidation phase. The flagpole represents the initial surge in price, while the subsequent consolidation forms the flag pattern. Flags are renowned for their ability to forecast the continuation of the prevailing trend, with a breakout above or below the flag pattern confirming the resumption of momentum.
Interpreting and Utilizing Pattern Analysis
“The stock market is a no-called-strike game. You don’t have to swing at everything – you can wait for your pitch.” – Warren Buffett
While recognizing these patterns is essential, successful trading requires a nuanced understanding of market dynamics and risk management strategies. Traders should exercise caution and corroborate pattern signals with other technical indicators. Moreover, it’s imperative to set clear entry and exit points, along with stop levels, to mitigate potential losses.
In conclusion, triangles, pennants, and flags serve as invaluable tools in the arsenal of technical analysts, enabling them to decipher market sentiment and anticipate future price movements. By mastering the art of pattern recognition and incorporating it into their trading strategies, investors can navigate the complexities of the stock market with confidence and precision. However, prudent risk management and a holistic approach to market analysis remain paramount in achieving sustained success amidst the ever-changing landscape of financial markets.
Furthermore, if you’re seeking a comprehensive book on patterns and other related topics, I recommend “Technical Analysis of the Financial Markets” by John J. Murphy. This seminal work covers a broad range of technical analysis concepts, from basic principles to advanced strategies, offering clear explanations and real-world examples. Murphy’s book serves as a solid foundation for understanding market behavior and honing your analytical skills, making it an invaluable resource for both novice and experienced traders alike.
**Here’s a little transparency: Our website contains affiliate links. This means if you click and make a purchase, we may receive a small commission. Don’t worry, there’s no extra cost to you. It’s a simple way you can support our mission to bring you quality content.**