

I find stock charts to be one of the most vital tools in my investing toolkit. They provide a visual snapshot of market activity, capturing the essence of price movements, trading volume, and the passage of time, all crucial for making informed trading decisions.
At the core of these charts are the unmistakable spikes and dips that tell the story of a stock’s past performance. With price represented typically by a line or bar, and volume often shaded below, each point on these charts marks a specific time frame, offering insight into the market’s heartbeat.
For those building a trading strategy, stock charts serve as a foundation. They make it possible to execute technical analysis, which is the practice of examining historical data to forecast future stock price movements. It’s about spotting patterns and trends which can be elusive without the clarity these charts provide.
Finally, the value of stock charts lies in their ability to convey complex information quickly. A glance can show you where a stock has been, and with the right analysis, hint at where it might be going. It simplifies the decision-making process, giving traders and investors alike a powerful way to digest financial data.
The Basics of Moving Averages in Stocks
Moving averages are foundational to stock chart analysis. Simply put, a moving average is the average price of a stock over a specific time frame. It smooths out price data, giving investors a clearer view of the trend without the noise of daily price fluctuations.
There are three primary types of moving averages that traders use: the simple moving average (SMA), weighted moving average (WMA), and exponential moving average (EMA). The SMA calculates the average stock price over a determined period, treating each day’s price equally. In contrast, the WMA gives more weight to recent prices, and the EMA further prioritizes recent prices, reacting more quickly to price changes than the SMA or WMA.
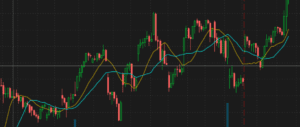
By identifying trends, moving averages help traders determine the stock’s momentum. When a stock’s price is above its moving average, it suggests an upward trend, whereas if it’s below, the trend might be downwards. The time period chosen for a moving average can significantly affect its sensitivity to price changes. For instance, a 50-day moving average will be less sensitive to daily price changes than a 10-day moving average, often resulting in smoother, less volatile lines on the stock chart.
IMPORTANT: Traders should choose the type and period of moving average based on their individual trading strategy and time horizon. Whether you’re looking at a few weeks or several years will directly influence the moving average parameters that will best suit your analysis.
Interpreting Moving Averages on Stock Charts for Better Trades
When you’ve got a grasp on the basics of moving averages, using them to refine your trading strategy is the next step. It’s all about signal interpretation. For starters, a moving average provides a smoothed line that helps to cut through the ‘noise’ of fluctuating prices, giving you a clearer picture of the market direction.
Bullish and bearish signals are like the stock market’s traffic lights. A bullish signal suggests prices might be ready to climb, while a bearish signal hints at a possible price drop. The moving average helps you spot these signals. For example, when a stock’s price rises above its moving average, this might point to a bullish trend. Conversely, when a stock’s price falls below the moving average, it could indicate a bearish trend is forming.
One particularly notable event is the crossover – think of it as the market’s way of waving a flag for your attention. A ‘Golden Cross’ occurs when a short-term moving average crosses above a longer-term average, signaling that a bull market could be on the horizon. On the flip side, a ‘Death Cross’ – when a short-term average slips below a long-term one – may suggest an upcoming bear market.
Beyond spotting trends, moving averages also act as dynamic support and resistance levels. A support level is like a floor that a stock’s price has trouble falling below, while a resistance level acts as a ceiling the price struggles to break through. By identifying these areas, moving averages can help you make more informed decisions about entry and exit points.
Remember, real-world examples are vital to understanding these concepts. As you start analyzing stock charts, observe how the price interacts with its moving averages in different scenarios. This insight can give you a real edge when entering or exiting trades.
Advanced Techniques and Best Practices with Moving Averages
Stock market investing is as much an art as it is a science. When it comes to using moving averages for analyzing stock charts, a thoughtful approach can carve out opportunities for better returns. Integrating multiple moving average strategies can provide a more nuanced view of market trends. For instance, using a short-term and a long-term moving average together can highlight potential buy or sell signals more accurately than relying on a single average.
Personal trading style plays a central role in setting up your moving averages. Day traders might prefer short time frames, while long-term investors could find more value in longer time periods. The key lies in the ability to modify the length of the moving average to align with your trading objectives. It’s important to TEST and REFINE the settings to find the sweet spot that resonates with your strategy.
No tool is infallible, and the same holds true for moving averages. They shine brightest when used in conjunction with other technical indicators like volume, RSI, or MACD. This holistic approach to technical analysis helps confirm trends and can be instrumental in reducing the risk of false signals.
While moving averages are incredibly useful, they are not the crystal ball of stock trading. You should be aware of their lagging nature. They are based on past prices and, as such, need to be used with a proactive and careful mindset. Remember, the stock market is notoriously fickle, and historical performance is not a guaranteed roadmap for future results.
Embrace these advanced techniques and best practices with an open mind and a commitment to continuous learning. Stay updated with market trends, regularly review your strategies, and keep a keen eye on how effectively your moving averages are working. With diligence and the right approach, moving averages can be a POWERFUL ally in your trading arsenal.
**Here’s a little transparency: Our website contains affiliate links. This means if you click and make a purchase, we may receive a small commission. Don’t worry, there’s no extra cost to you. It’s a simple way you can support our mission to bring you quality content.**