

Introduction:
In the world of stock trading, analysts and traders often rely on chart patterns to identify potential opportunities in the market. One such pattern that has gained popularity among investors is the “cup and handle” pattern. This pattern is widely used for its predictive value in determining potential bullish trends. Understanding the dynamics of the cup and handle pattern can provide valuable insights for traders looking to capitalize on market movements.
What is the Cup and Handle Pattern?
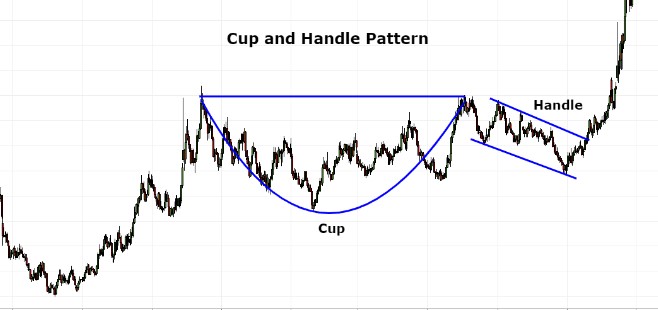
The cup and handle pattern is a bullish continuation pattern that typically forms during an uptrend in a stock’s price. It consists of two main parts: the cup and the handle. The cup portion resembles a rounded bottom formation, while the handle represents a consolidation or a minor pullback before the stock resumes its upward trajectory.
The Cup:
The cup formation is characterized by a gradual decline in the stock’s price followed by a rounded bottom that resembles a “U” shape on the chart. This phase usually occurs over several weeks or months and reflects a period of accumulation by investors. During this time, sellers are gradually absorbed, and buyers begin to regain control, leading to a gradual increase in buying pressure.
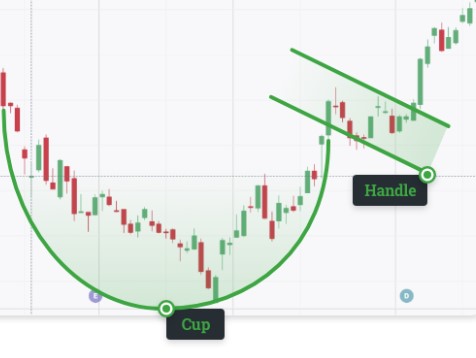
The Handle:
Following the completion of the cup formation, the stock typically experiences a short-term consolidation or pullback, forming what is known as the handle. The handle is characterized by a slight downward drift in the stock’s price, usually on lower trading volume. This phase allows the stock to digest its recent gains and build a base of support before attempting to move higher again.
Key Characteristics of the Cup and Handle Pattern:
Symmetry: One of the key characteristics of the cup and handle pattern is symmetry. The cup formation should have a smooth and rounded bottom, without any sharp or sudden movements. Similarly, the handle should be relatively symmetrical and not too deep compared to the cup.
Volume: Volume analysis plays a crucial role in confirming the validity of the cup and handle pattern. Ideally, the volume should decline as the stock forms the cup formation, indicating decreasing selling pressure. During the handle formation, volume should also diminish, signaling a decrease in trading activity as the stock consolidates.
Duration: The duration of the cup and handle pattern can vary, but typically, the entire formation takes several weeks to complete. Traders should exercise patience and wait for the pattern to fully develop before considering it as a potential trading opportunity.
Breakout: The breakout from the handle is a critical component of the cup and handle pattern. Traders look for a decisive move above the resistance level formed by the high point of the cup formation. Ideally, the breakout should occur on above-average volume, confirming strong buying interest.
Trading Strategies:
There are several strategies that traders employ when trading the cup and handle pattern:
- Entry: Traders often look to enter a position after the stock breaks out from the handle formation. This typically involves placing a buy order slightly above the resistance level of the handle, with a stop-loss set below the recent lows to manage risk.
- Confirmation: Some traders prefer to wait for confirmation of the breakout by observing increasing volume and strong price momentum. This approach helps to reduce the risk of false breakouts and increases the probability of success.
- Target: The target price for a cup and handle pattern can be determined by measuring the depth of the cup and projecting it upwards from the breakout point. Additionally, traders may use other technical indicators or chart patterns to identify potential price targets.
- Risk Management: As with any trading strategy, risk management is essential when trading the cup and handle pattern. Traders should always use stop-loss orders to limit potential losses and adhere to proper position sizing to preserve capital.
Example:
Let’s consider an example of a cup and handle pattern in a hypothetical stock, ABC Inc.:
- ABC Inc. is in an uptrend, and over several months, it forms a rounded bottom, resembling a cup formation.
- Following the completion of the cup, the stock experiences a brief consolidation phase, forming a handle pattern.
- The breakout occurs as the stock’s price surpasses the resistance level of the handle on above-average volume.
- Traders enter long positions, anticipating further upside momentum.
- The stock continues to rally, reaching the projected target price based on the depth of the cup formation.
Conclusion:
The cup and handle pattern is a popular technical analysis tool used by traders to identify potential bullish trends in the stock market. By understanding the key characteristics and trading strategies associated with this pattern, traders can effectively capitalize on market opportunities and enhance their trading success. However, it’s essential to combine the cup and handle pattern with other technical indicators and risk management techniques for optimal results. As with any trading strategy, proper research, practice, and discipline are key to achieving consistent profits.
**Here’s a little transparency: Our website contains affiliate links. This means if you click and make a purchase, we may receive a small commission. Don’t worry, there’s no extra cost to you. It’s a simple way you can support our mission to bring you quality content.**